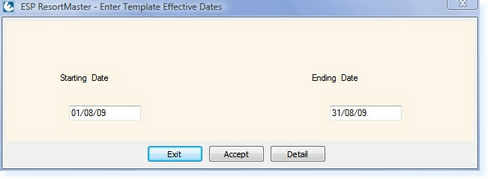
Upon selecting one of the reports you will see the following screen.
Enter the Start and End dates for the range you wish to view a report for. The data will then be transferred to Microsoft Excel, as shown in the examples below.
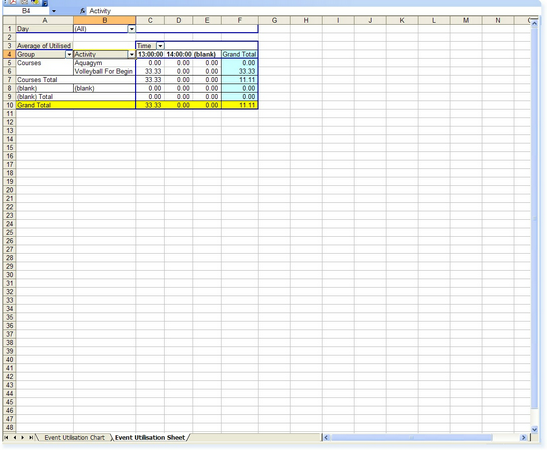
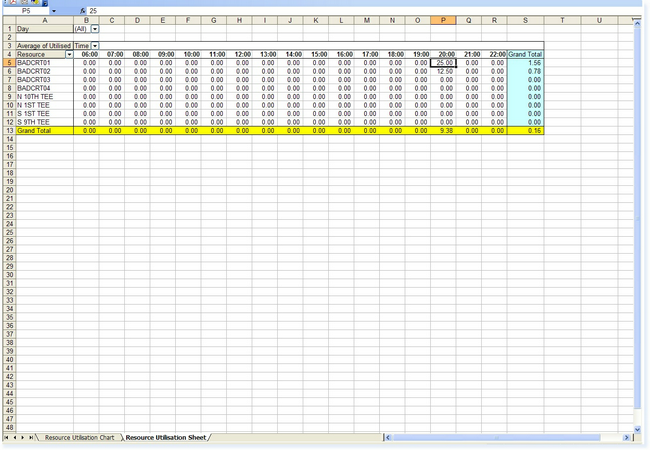
The data will be arranged into a PivotTable which will allow you to customise the report. It will show you as a percentage, what the utilisation was for the Resources or for the Events which have taken place throughout the date range. These are spoilt by hours of the day.
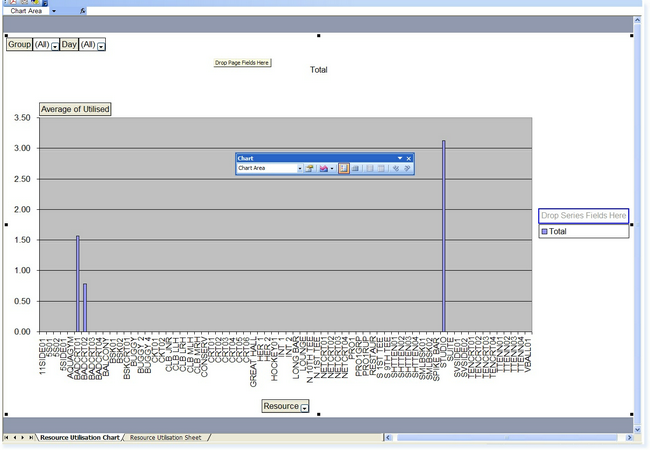
In addition there is also a second tab at the bottom of the Excel Workbook, labelled Utilisation Chart. This will allow you to see the results of your data as a chart instead of raw data. An example is shown below.
|